The Bimodal Nature of the NEA Population
J S Lewis
The Bimodal Nature of the NEA Population: The Fallacy of the “Average” Asteroid
John S Lewis
Most authors who treat this subject estimate that 20-30% of the NEA population consists of carbonaceous (C type) asteroids and the closely aligned B, D, F, G, K and P types, which we refer to collectively as C-cadre asteroids (see 1.1 above). But the way in which such estimates are obtained is tortuous and imprecise; even seriously misleading, since these estimates are often represented as relative masses or as population counts, even though the two categories have very different statistics.
In the following text we develop the argument that a properly de-biased estimate of the proportion of C-cadre object abundance in the NEA population is more likely to be in the range 53 to 61%.
The most important single observational datum used in assessing the size and nature of the NEA population is the brightness of the asteroid in visible light: the absolute (H) magnitude. Only a small subset of the NEAs have measured reflectivities at visual wavelengths (albedo, the fraction of impinging light that is reflected, represented by the symbol pv). Some NEAs have actual spectral data over the visual wavelengths and near infra-red, permitting identification of spectral features diagnostic of the constituent minerals.
Because so few of the smaller NEAs have spectral data available, the only available means for estimating their size is their visual brightness at a standard distance of 1 AU, reported as H magnitude. This is often used as the sole source of size information. But sizes can be deduced from H magnitudes only if an assumption is made about the reflectivity of the asteroid. Real asteroids vary in reflectivity (albedo) over a very wide range, from less than 0.023 (meaning that only 2.3% of the incident visible sunlight is reflected) to at least 0.64. Thus simply assuming an average albedo can lead to very misleading conclusions about the sizes and masses of the individual bodies treated in this manner. As an example, two asteroids of equal absolute H magnitude with these extreme albedos differ in volume by a factor of 127. Their masses may easily differ by up to a factor of 100.
The usual method of estimating the population statistics of asteroids generally assumes that all spectrally uncharacterized asteroids have albedos of 0.14, the rationale being that this is the average albedo of the NEAs with known albedos. This assumption is then used to calculate a diameter, volume, and mass for each observed body. This is analogous to examining an aerial photograph of a zoo and estimating the mass of the average zoo animal from the images. It is clear that light-colored(highly reflective) and large animals will be preferentially discovered. For any given size, especially for smaller animals, the high-albedo animals will be far easier to detect, so the number of detected animals will be dominated by the brighter ones. For any given level of total brightness, the average albedo we calculate will be dominated by the numerous small bright animals. Large, dark animals will have their sizes dramatically underestimated, and small dark animals, however numerous, will be missed completely. These systematic errors lead to a dramatic underestimate of both the total number of dark animals and their contribution to the total mass.
Accurate size measurements are achieved only through two methods. One is for an asteroid to be sufficiently large and/or pass sufficiently close to Earth that telescopes (or radar soundings) can resolve a disk whose diameter can be measured, rather than simply seeing it as an unresolved dot of light. The other way is for an infrared telescope to measure the infrared spectrum (heat)emitted by the object; the wavelength of the peak emission will tell the temperature T of the surface. The total infrared brightness (the total flux of heat) emitted is directly related to the temperature (proportional to T4) and to the surface area of the object (proportional to the square of the radius r2). Using the temperature determined from locating the wavelength of the intensity peak in the emission spectrum, together with the total flux, the radius can then be calculated directly.
Realistic Spectral Population Data
We know quite a lot about the population of the Asteroid Belt between Mars and Jupiter. It is clear that at least 60% of the known Belt asteroids belong to the C (carbonaceous) spectral type, having albedos close to 0.05. This is true even though there is a bias against detecting such intrinsically dark material, and even though the C asteroids are dominant in the outer half of the Belt where the intensity of sunlight is ten times lower than it is at Earth. But several other spectral types, including the B, D, F, G, K, and P types mentioned earlier, are closely related in appearance and composition to the C asteroids (and are collectively referred to as the C cadre asteroids)
- C type asteroids have spectra that closely match laboratory spectra of CI and CM carbonaceous chondrite meteorites. They are very volatile-rich, containing up to 20% water and 6% carbon, plus sulfur in the form of sulfide minerals, organic S compounds, elemental sulfur, and sulfates; and oxygen in magnetite, sulfates, and carbonates. Roughly 40% of the mass of CI chondrites is in the form of extractable volatiles. The outer half of the main asteroid Belt is dominated by C and related asteroid types. The target of the Hayabusa-2 probe, 1999 JU3 Ryugu, is a C-type.
- K type asteroids resemble the CV and CO chondritic meteorites, which hare also carbonaceous but contain several times less volatiles than the CI and CM types. The absence of a 3-micron water band implies a water content that is probably less than 1%, in agreement with the meteorite data.
- D type asteroids are dominant in the very outer regions of the asteroid population, including the Jupiter Trojan asteroid families. The only meteorite in our collections that appears to bea close match to D asteroids is the carbonaceous Tagish Lake stone. These asteroids also have close chemical and dynamical associations with Jupiter-family comets. In space, D-type material may contain water ice in addition to water in phyllosilicates.
- P type asteroids also have their maximum abundance in the outer asteroid belt. These asteroids are extremely dark, commonly with albedos less than 0.04. Several P-type asteroids have highly eccentric orbits characteristic of short-period comets, which suggests a high content of water ice.
- B type asteroids have the spectral signature of both hydrated and anhydrous silicates with dark magnetite and organic polymers. Laboratory studies suggest that the spectrum of B asteroids can be matched by moderate heating of C type asteroid material. The B type NEA1999 RQ36 Bennu is the target of the NASA OSIRIS-R Example-return mission.F type asteroids have a close spectral similarity to B asteroids, but lack an absorption feature in the 3-micrometer wavelength region which is attributed to waterG type asteroids include the largest Belt asteroid, Ceres, show a spectral feature attributable to chemically bound water and probably represent C type material that has undergone mild thermal alteration. The Dawn spacecraft, making observations while orbiting Ceres, has brought about a revolution in our understanding of this spectral type.
The situation is further complicated by the fact that some asteroids that exhibit relatively flat and featureless reflection spectra have never been observed in the thermal infrared, and therefore have unknown albedos. These X type asteroids of any given magnitude could be small and highly reflective (E type), moderate-sized and moderately reflective (such as most M type asteroids), or relatively large and dark (all C cadre types). This ambiguity can be resolved only by thermal infrared observations or direct radar measurement of their size. The absence of thermal infrared and radar data is a major knowledge gap in defining the population statistics of the NEAs
Bias Correction
Clearly some effort is required to correct for the biases against discovery of the intrinsically dark (low albedo) asteroids and against spectral characterization of the fainter ones.
An example of these efforts is the careful analysis of NEA data by Stuart’s 2004 PhD dissertation at MIT, in which he analyzed a large body of data from the Lincoln Laboratory’s LINEAR asteroid-search program. Stuart’s analysis, which is in rather close agreement with the results of other studies using different asteroid data sets and slightly different definitions of the asteroid spectral types, concludes that 9.9±0.4 % of the NEAs belong to the C type and 17.6±0.8% belong to the D type (i.e., C+D =27.5%). The C asteroids have spectra that closely resemble those of the carbonaceous meteorites and have albedos of pv= 0.10±0.027; the D asteroids have pv= 0.042±0.013 and as noted above are thought to be possibly cometary in origin. Albedos among the NEAs are found to run as low as 0.023, a degree of blackness not achievable with black paint and best simulated by black velvet, in which multiple scattering of incident sunlight off extremely dark surfaces reduces the total reflected light to unprecedentedly low levels.
But one of the most common spectral types among the NEAsis the annoyingly vague X type. The X designation connotes asteroid materials that are spectrally bland, without distinctive absorption features, with a general “red slope” and whose albedos are not known. Thus bright white, grey, or black materials of unknown albedos are all lumped together as X type asteroids. It is generally accepted that the X type asteroids include extremely bright E type enstatite achondrites (pvgreaterthan 0.3 and perhaps as high as 0.6 to 0.7, consisting of FeO-free silicates with no absorption bands characteristic of olivine or pyroxene). Also lumped among the X type are the M type (metal-dominated) asteroids, which have albedos ranging from 0.1 to 0.25. The average M type Belt asteroid has pv= 0.17. The M asteroids’ bland, red-sloped spectra are characteristic of both metallic(“iron”) meteorites and some stony-irons. The third population that is often lumped into the X type is the P type, very primitive and presumably carbon-and water-rich bodies, with albedos less than0.1 and averaging below 0.04. These are characteristic of materials found in the outer regions of the asteroid belt, peaking in abundance at heliocentric distances beyond the C type asteroids. Stuart assigns 34.1±1.38% of the NEAs to X type, for which he finds a very low mean albedo of 0.072±0.025
Breakdown of X Type Asteroids
The question of the probable statistical contributions of E, M and P asteroids to the X type is of course best addressed by measuring the albedos of the X type bodies, which as previously noted is extremely hard to accomplish. In the absence of such new data, however, we are forced to look at other sources of data on the relative abundances of these types of material in near-Earth space. By far the best source of such data is the rates of fall of these meteorite types on Earth. The raw statistical data are informative: bright E type (enstatite achondrite) material makes up less than 0.3%of the meteorite flux onto Earth. M type bodies (irons; some mesosiderite stony-irons)make up about 5% of the meteorite fall rate. Assessing the rate at which P type material enters Earth’s atmosphere is very difficult because of its extreme fragility. No recovered meteorite is known that belongs to the P spectral type. The selection effect against survival of P type rocks entering Earth’s atmosphere is profound: we observe numerous carbon-rich and extremely fragile meteors which disintegrate and vaporize at high altitudes, though we seldom see a meteor1that appears to be metallic.
Setting the total influx rate of recovered meteorites at 100%, we would expect the proportions of E and M material in space to be about 0.3% and 5%. The proportion of weak, non-surviving P material is very difficult to estimate, and could easily surpass 100% (equal to or even greater than the flux of strong, recoverable meteorites). Let us very crudely estimate that the relative fluxes of E, M and P material in near-Earth space are in the ratio of 0.003:0.05:1. The E:M ratio is probably reliable; the P contribution is large but uncertain. Note that C type material makes up about 3.5% of the meteorite fall rate. C chondrite meteorites are indeed much more fragile than most stony meteorites (crushing strengths of 1-10 bars for CI and CM chondrites compared to 100-1000 bars for most other stones and 3500 bars for irons), so it is reasonable to expect that there is significant discrimination against their survival during atmospheric entry. Their fractional abundance in the meteorite source mix (which is overwhelmingly dominated by NEA debris) can reasonably be assumed to be several times larger than the 3.5% of surviving C stones in our meteorite collections. Indeed, spectral data on the NEAs agree with this expectation (Stuart finds 9.9% C).
Given these data from meteorite and meteor observations, what can we say about the X type NEAs? First of all, the average albedo of 0.072 found for X asteroids in Stuart’s analysis of the NEA spectral data is in complete harmony with the idea that E asteroids, which contribute few meteorites despite their high crushing strength and which have very high albedos, make up a negligible proportion of the X population. Second, from the meteor fireball data we are prepared to believe that P material.
1A “meteor” is purely an optical phenomenon, referring only to the bright streaks of light seen in the sky. Objects that reach the ground are “meteorites.” is much more abundant than M material in the flux striking Earth’s atmosphere. Stuart’s mean albedo of 0.072± 0.025 for X asteroids, if composed of n% M material with average albedo 0.17 and (100-n)% P material with albedo 0.04, would be satisfied by 25% M material and 75% P material. Taken by itself, pv= 0.072 implies dominance of C-cadre (P type) material.
Thus, the total abundance of volatile-bearing C-cadre material (B, C, D, F, G, K, P) among the NEAs, including 75% of the X type population as P type, would then be 9.9 (C, B, G)+ 17.6% (D) +0.75×34.1% (P) =53 %. Note that the upper limit would be to take all the X asteroids as P type, in which case the C-cadre total would be 9.9 + 17.6 + 34.1 =61.6% of the NEA population.
NEA Population Models
We will explore the ramifications of the upper and lower limits on the C-cadre abundance, using 30% dark for the lower limit (which allows only 10% of the X bodies to belong to the C cadre) and 61% dark for the upper limit (which takes about 90% of the X asteroids to be C cadre). It is interesting that Gene Shoemaker, writing 25 years ago, concluded that the proportion of very dark bodies (C cadre in our terminology) among the NEAs was 30 to 60%. Binzel et al. (Science 257, 779, 1992)predicted that up to 40% of the NEA population could be extinct nuclei of periodic comets; i. e., 40%P type.
We will calculate a population model for all asteroids having the same H magnitude. The most conservative estimate of C cadre abundances (case A) would entail using an abundance of 30% of the NEA population and an albedo distribution typical of the observational data on the NEAs, which typically show a somewhat higher average albedo for each type of asteroid than that of the corresponding asteroid type in the Main Belt. The more generous (but still realistic) estimate of C-cadre prevalence (case B) will assume 61% of the NEA population and an albedo distribution typical of the Main Belt, where the C type has its abundance peak at pv= 0.05 and the S type peaks at pv=0.20.
The procedure will be to set a fixed H magnitude and construct a set of 100 asteroids consistent with that brightness, ranging from small and very reflective bodies to large, dark bodies. The relative proportions of bodies of different albedos will be fixed by the over all statistical distribution of albedos in the given reference population (NEA data for case A and Main Belt data for case B). For each of ten different albedo bins we will generate a mean albedo for that bin, the number of asteroids in that albedo bin (out of the total of 100 bodies), the radius, cross-section area, and volume of each body, and, using laboratory density data on the meteorite analogues of these asteroid spectral types, their calculated masses. We will then add up the total mass in each albedobin and the total population mass summed over all 10 bins.
The conventional assignment of masses to bodies with known H magnitude and unknown albedos is to take an average albedo of pv= 0.14 for the entire NEA population. Stuart and many others are in close agreement on that average, which is determined by averaging observations of many NEAs. The biases introduced against the discovery of dark NEAs and against the successful collection of optical data on faint bodies are estimated and used to arrive at this average. Typically, since so few NEAs have good spectral and albedo data, this average albedo is used to calculate an asteroid size that corresponds to each H magnitude. Thus we see tables purporting that there are 980 asteroids over 1000 m in diameter, when what is really meant is that, assuming an albedo of 0.14, a 1000 masteroid has an H magnitude of 17.75, and there are 980 NEAs brighter than that magnitude.
This is statistically defensible, but conveys a very poor sense of the actual sizes of those asteroids of equal H magnitude: some are small and highly reflective and some are very black and much larger. Two asteroids near the extremes of albedo (pv= 0.64 and pv= 0.032) with the same H magnitude differ by a factor of 20 in cross-section area and by a factor of (20)3/2= 90 in volume. The more reflective one is probably an E type aubrite with density 3.2; the darkest is probably a D type extinct periodic comet core with density 1.6 or lower. Thus the smallest and largest individuals in any sample of equal H magnitude should differ by at least a factor of 45 in mass. The same generalization probably applies equally well to any choice of H magnitude except for the (statistically unreliable small number) of bodies over 3000 m in diameter. If there is any systematic change of asteroid composition with size, it has not been found in NEA observations to date. Indeed, with respect to the 9 largest NEAs (all those with diameters greater than 3000 m), three belong to spectral types B, C and D (3200Phaethon, 1580 Betulia, and 3552 Don Quixote, respectively).
For those interested in asteroid resources, the difference between these albedo extremes is of great importance: a 1000 tonne E achondrite contains no water or metal; a D asteroid of equal H magnitude would weigh in at 45,000 t and contain up to 60% water by mass, for 27,000 t of water and an additional 4000 t of other volatiles. For those interested in planetary defense, the difference between a weak mud-ball massing 45,000 t and a hard rock massing 1000 t is profound, because the mud ball will break up at extreme altitude, whereas the highly competent rock will penetrate much deeper into the atmosphere, and perhaps even to ground level.
The results for the “conservative” calculation (case A) are presented in Figs. 1 and 2. In this and the case B calculations below, the masses of individual objects are scaled asr3, the density times thescaled volume. The reference mass (mass unit) in these calculations is the mass of a body with albedo 0.14, density 2.7 and unit size, withr3= 2.7. Thus the total mass of a population of 100“average” bodies is 270. These scaled (dimensionless) masses can be converted into real (kg)masses only if the H magnitude and actual size of the reference “average” body is specified. Fig. 1shows the sizes (cross-section areas) of the 100 bodies that were generated using NEA albedo statistics and a 30% abundance of C-cadre asteroids. Fig. 2 shows the masses of these same 100asteroids, 339 scaled units. The total scaled mass calculated for the simplistic assumption that all bodies have an albedo of 0.14 and identical size (270 units) is too low by about 20%, an unimportant error. Much more significant is that 30% of the bodies are of C-cadre composition and yet account for 67% of the total mass, even with the likely incorrect assumption of an average albedo of 0.14.
(An aside on the concept of “average” albedo: note that, for any H magnitude category, meaning equal visual brightness, an S asteroid with albedo 0.257with a mass about 1.5 dimensionless units and a D asteroid of albedo of 0.023 with a mass about 33 dimensionless units differ by a factor of 22in mass. These two asteroids have an average albedo of (0.257+0.023)/2 = 0.14, but the combination of the twois 96% D material; in other words, the vast bulk of asteroidal material is volatiles-rich.)
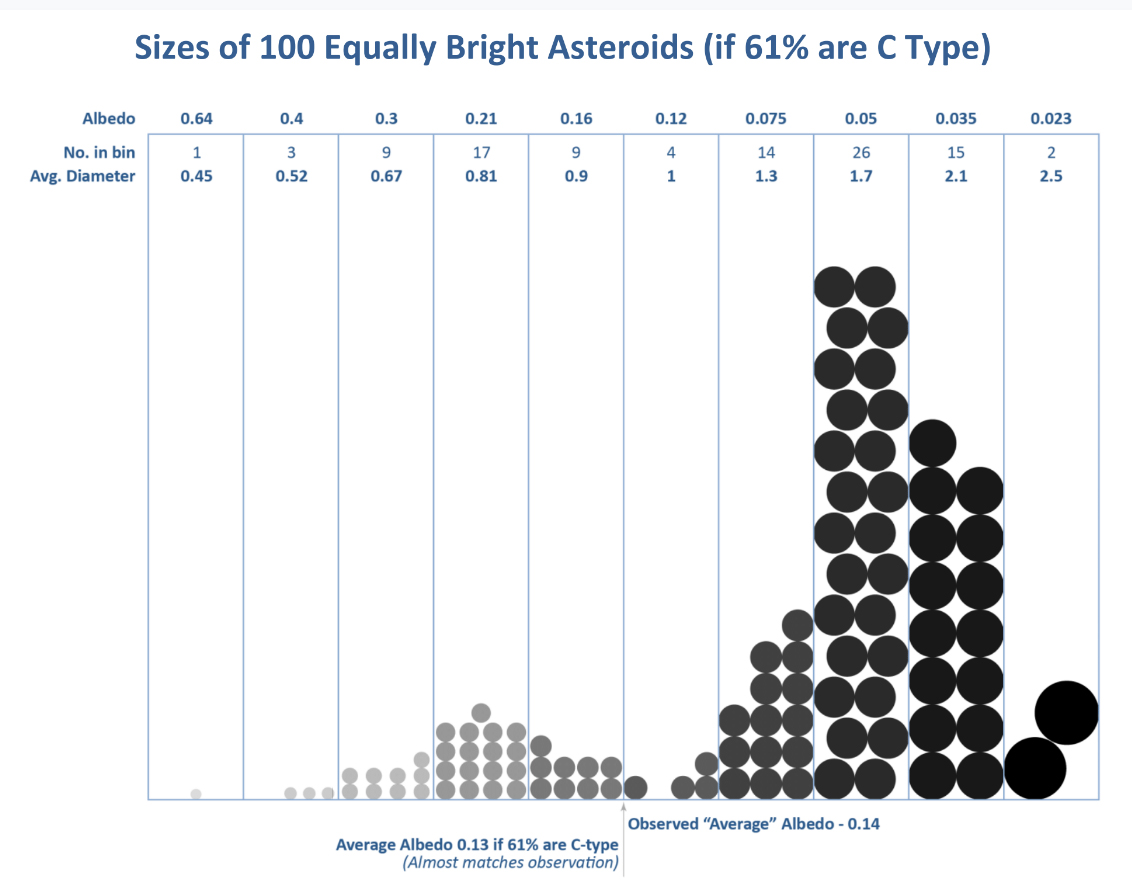
The calculations for case B, in which we assume a 61% abundance of C-cadre asteroids and the spectral type distribution characteristic of the Main Belt asteroids, is summarized in Figs. 3 and 4.
The first of these figures presents, as in Fig. 1, the size and cross-section areas of the population of 100 asteroids. Case B, however, results in an average albedo of 0.13, much closer fit to the observed average of 0.14than the 0.205 average albedo for the distribution assumed in Case A. Therefore the Case B assumption of a greater abundance of dark NEAs is likely much closer to the truth.
Again, Fig. 4, as in Fig. 2, portrays the mass distribution of the 100 equal-magnitude asteroids. The mass of the C-cadre asteroids exceeds that of all the S-cadre asteroids combined by a factor of 10.3,with the C-cadre asteroids making up 91.1% of the total mass. The total mass that would be estimated by the usual rule of thumb (pv= 0.14) would fall short of the actual total mass by a factor of about 2.8. Case B seems more realistic in that, in Stuart’s debiased NEA population model (his Table 4.7) the mean albedo of the X type, 0.072, lies between those of the D type (0.042) and the C type (0.101), strongly implying a dominance of C-cadre material in the X population.
(The correlation of X asteroids with the Tisser and criterion is also telling: among Jupiter-related asteroids (TJ<3) the D asteroids, in orbits like those of periodic comets, make up 43.5±20.4 % of the population and X asteroids make up another 38.5±15.6%.
In both cases A and B, the “average” asteroid is close to the minimum in the number-vs-albedo curve, lying between the two prominent abundance peaks that correspond to S-and C-cadre bodies. In both cases the results apply for any H magnitude that one would care to use: the conventionally estimated total mass of all asteroids fainter than H = 17.75 (or 19 or 20) is clearly too low by a factor of 1.2 to 2.8 and the mass fraction of C-cadre asteroids is dramatically understated. The Figures document the point that the “average” asteroid is a rare beast indeed.
The number-distribution of S versus C-cadre material is crucial; it demonstrates that 53-61% of all potential NEA targets are C-cadre. There are thus better-than-even odds of encountering a volatile-rich NEA even if no spectral or albedo information is available for a particular target.
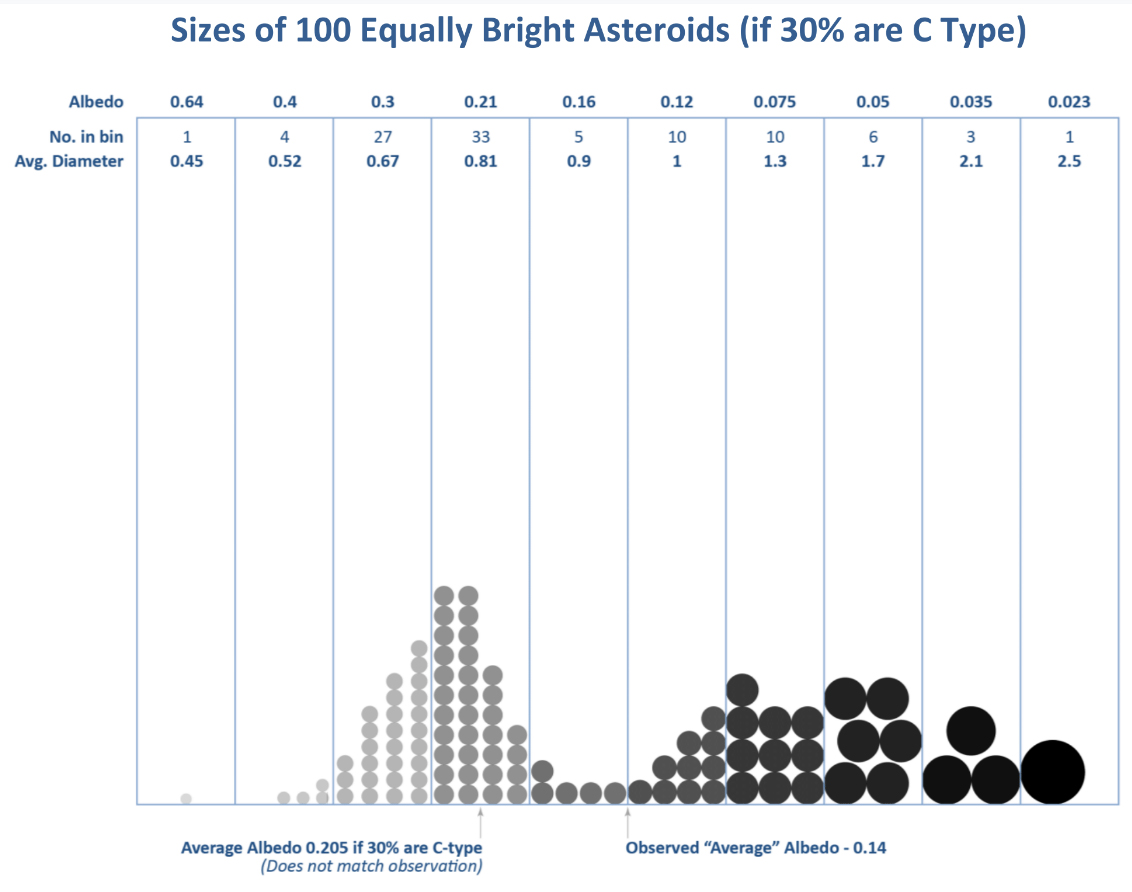
Figure 3-1–Sizes of 100 Equally Bright Asteroids (30% C). A set of 100 equally-bright NEAs is generated subject to the assumption that 30% of the NEA population is C-cadre material with an NEA albedo distribution (albedo near 0.08) and 70% is S-cadre (albedo near 0.24). The traditional “average” NEA with albedo = 0.14 is marked with an arrow. Note that this albedo corresponds to a minimum in the distribution. The asteroids are subdivided into 10 albedo bins ranging from0.023 to 0.64. The model diameteris scaled to the “average” asteroid with r = 1 dimension less unit). The asteroid sketches are drawn to scale. The average albedo found by this model is 0.205,which is much brighter than the canonical “average”. This discrepancy can be resolved only if there are far more dark asteroids than the 30% we assumed.
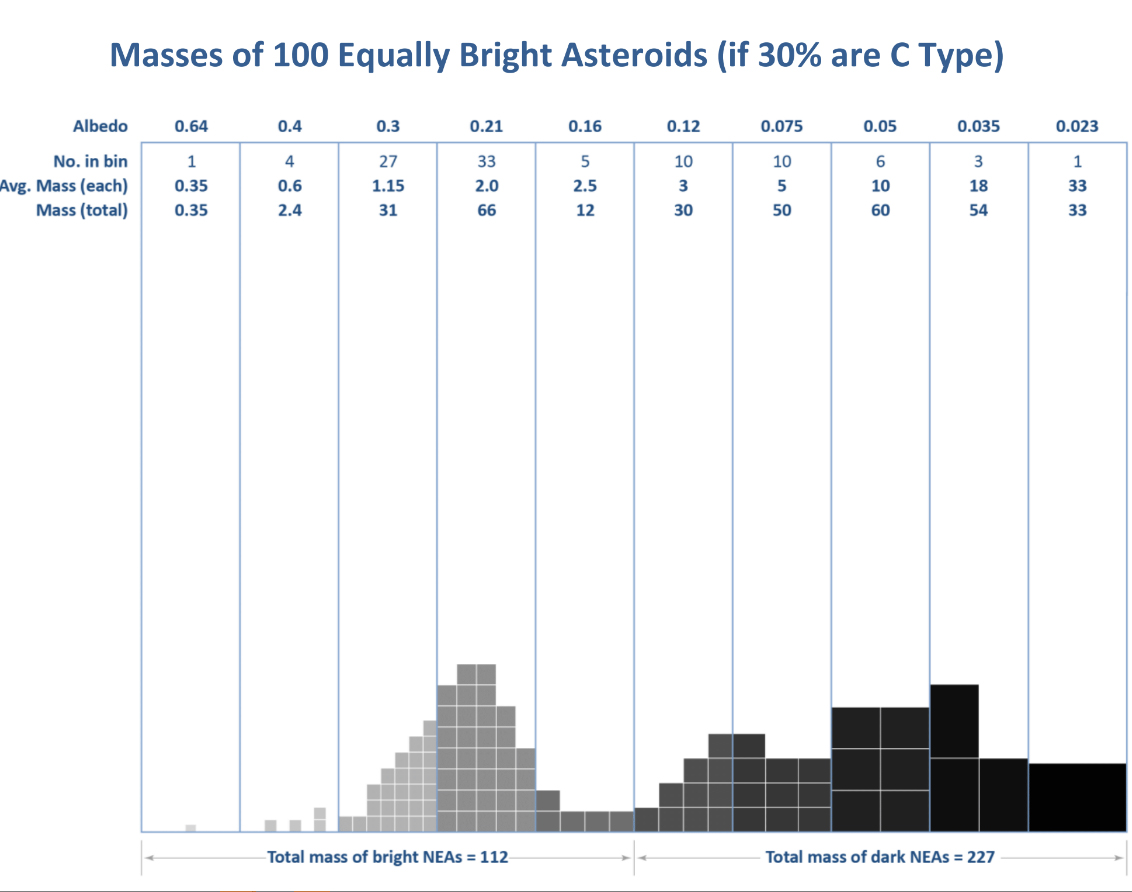
Figure 3-2–Masses of 100 Equally Bright Asteroids (30%C). The masses of the asteroids generated in Fig. 1 are displayed for each of the ten albedo bins. The diameters of the individual asteroids in Fig. 1 are used to calculate volumes, and a density appropriate to each spectral group is used: 3.5g cm-3for S asteroids, 2.1 for C asteroids, and 1.6 for the darkest albedo bin.
Figure 3-3–Sizes of 100 Equally Bright Asteroids (61% C). A set of 100 equally-bright NEAs is generated subject to the assumption that 61% of the NEA population is C-cadre material with a Main Belt albedo distribution (albedo peak near 0.05) and 39% is S-cadre (albedo peak near 0.20).The traditional “average” NEA with albedo is 0.14. Diameter is scaled relative to the “average” asteroid. The asteroid sketches are drawn to scale. The average albedo found in this model is0.13, within the uncertainty of the widely-accepted observational NEA average of 0.14±0.01.
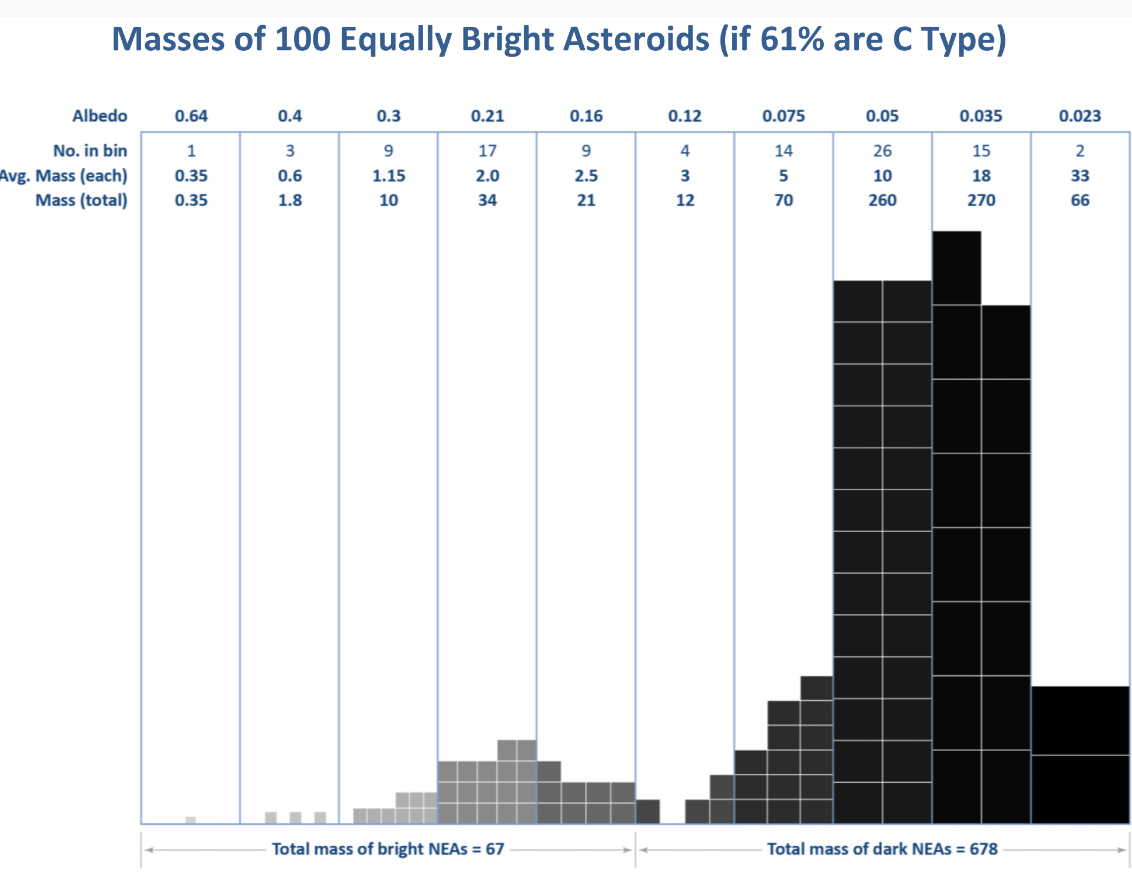
Figure 3-4–Masses of 100 Equally Bright Asteroids(61%C). Format and asteroid densities are as in Fig. 2. This shows that the more likely assumption of 61% of NEAs being C-cadre results in more than 90% of the total NEA mass being volatile-rich dark asteroids.